EUR/USD finally showed good volatility on Wednesday, but this was an isolated incident. Yesterday's ADP and ISM reports, which are important reports, came in weaker than expected, and this weighed heavily on the US dollar. However, overall, volatility remains low. Some traders might have even forgotten what normal volatility looks like. Let us remind you that a year ago, in just a day there could be 5-6 signals on the 5-minute timeframe. It could take the pair just a couple of days to cover a range of 100-200 pips. Readers may hold various opinions about our statements on low volatility. Some might think that the EUR/USD pair is trading with normal volatility right now. However, we don't see much sense in trading an instrument that moves only 40-50 pips in a day.
Traders should understand that 40-50 pips is not a solid movement from point "A" to point "B." It could be a series of microscopic movements of 20-30 pips, which no one will even have time to enter. The same goes for the 4-hour timeframe. The pair can stand in one place for weeks, only occasionally showing sections of a trend. This is actually normal, as trends usually end faster than a flat or corrective movements. But what kind of trend are we talking about when the last segment of the trend was only about 100 pips?
Yesterday, there were published reports on the Services PMIs of Germany and the EU but the market didn't pay attention to these reports. The US released more significant data and they fueled slightly stronger movements. Thus, in the first three days of the week, we observed small movements despite a rather serious fundamental and macroeconomic background. A calm state in the market at its finest.
Today the US is in observance of the Independence Day holiday. Trading will be weaker than usual. If the EUR/USD pair has been showing volatility of 40-50 pips in recent days and weeks, today it might move even less. Friday is the last chance to show any significant movement. If the Nonfarm Payrolls and unemployment reports in the US don't trigger a strong reaction, then EUR/USD can be put on hold for a while.
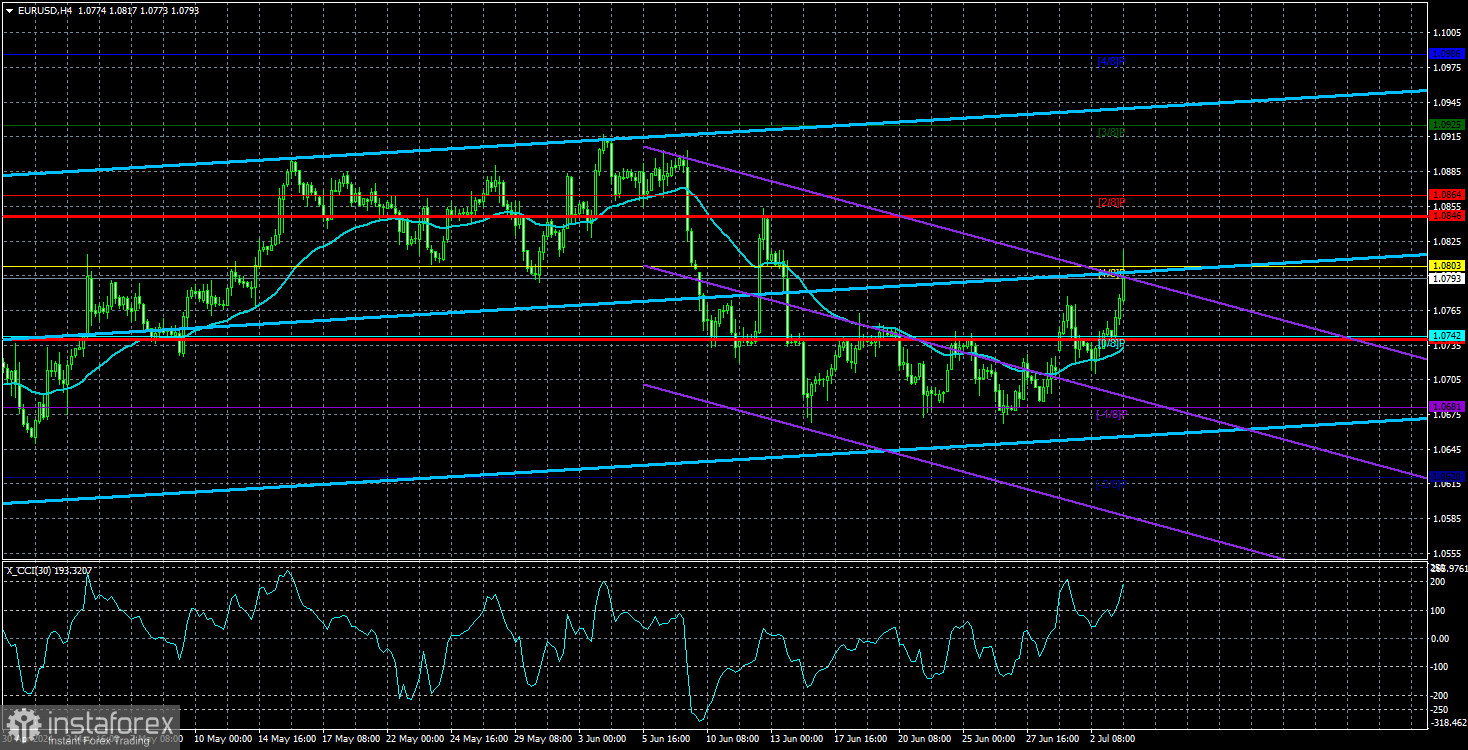
Nevertheless, we still expect the euro to fall, despite its growth on Wednesday. Yes, the latest US reports turned out to be weaker than expected. Indeed, the US economy is slowing down, but then again the Eurozone economy is not in the best shape. The European economy is expected to accelerate in the coming quarters as the European Central Bank has begun to ease monetary policy. But what about the fact that it has eased policy, which is considered a bearish factor for the single currency? On the 24-hour timeframe, the price hit the critical Kijun-sen line, from which it could very well bounce. The euro has not even reached any of the medium-term targets yet.
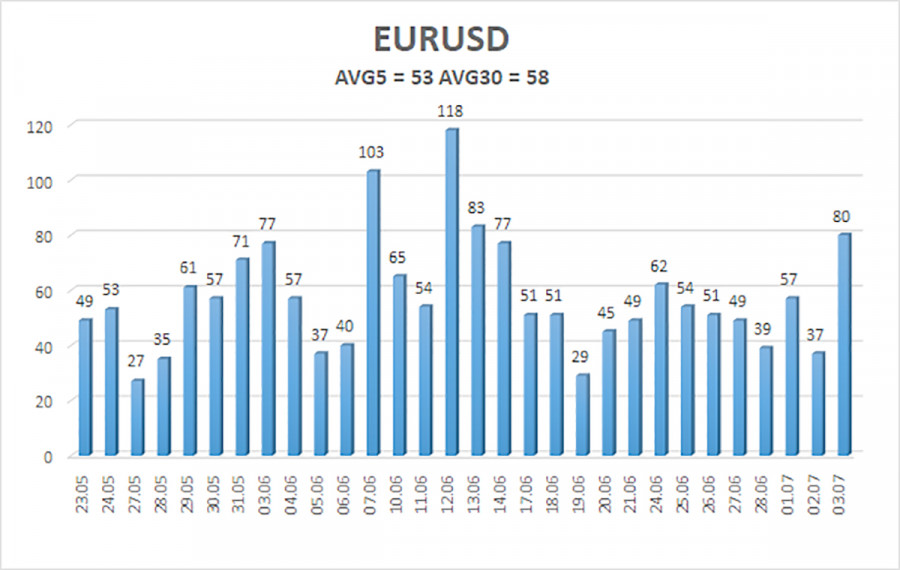
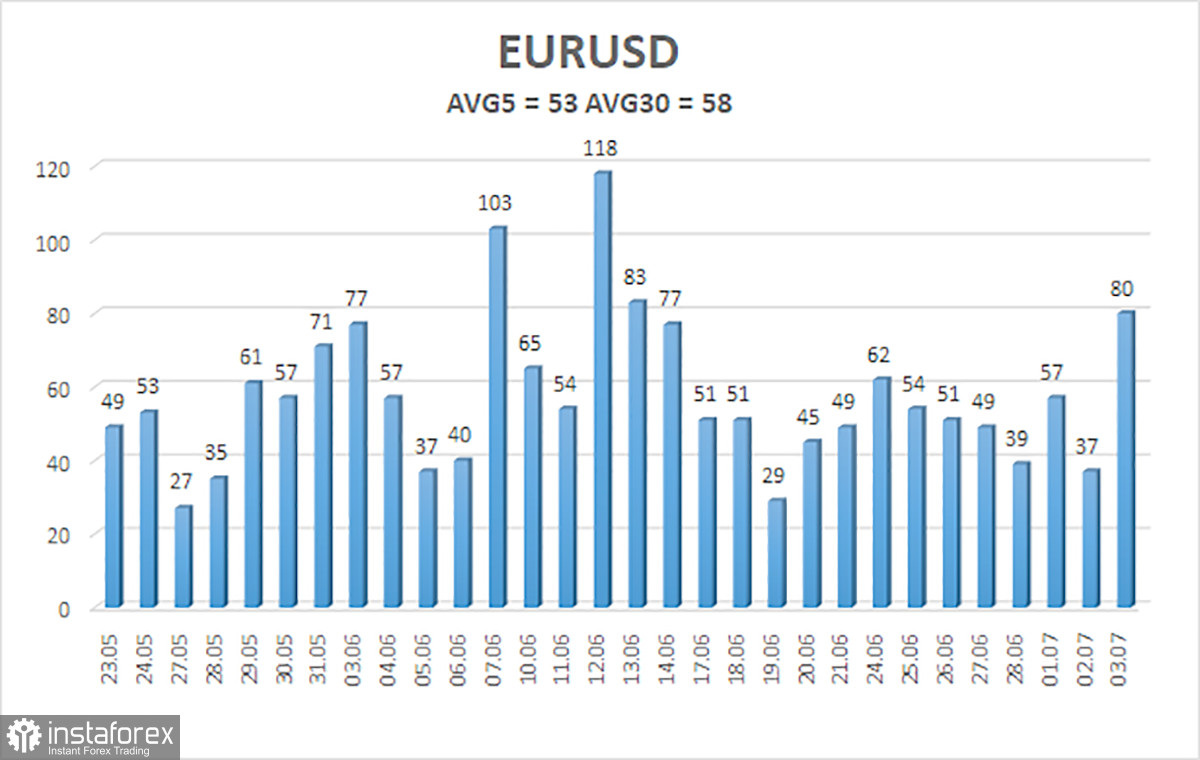
The average volatility of the EUR/USD pair over the last five trading days as of July 4 is 53 pips, which is considered a low value. We expect the pair to move between 1.0740 and 1.0846 on Thursday. The higher linear regression channel is directed upwards, but the global downtrend remains intact. The CCI indicator entered the oversold area, but it has already been worked out by a bullish correction.
Nearest support levels:
S1 - 1.0742
S2 - 1.0681
S3 - 1.0620
Nearest resistance levels:
R1 - 1.0803
R2 - 1.0864
R3 - 1.0925
Trading Recommendations:
The EUR/USD pair maintains a global downtrend, and the price is located above the moving average on the 4-hour timeframe. In previous reviews, we said that we are waiting for the continuation of the downward trend. At this time, short positions remain relevant, but the corrective move may continue for some time. The third consecutive rebound from 1.0681 provoked another round of the bullish correction. We don't recommend buying the euro, as we believe that the global downtrend has resumed, and the single currency has no grounds for growth. But the price may rise for some time as part of the correction. Especially this week, when the US will release more important reports, and among those have been published, we've already seen quite weak ones.
Explanation of the chart:
- Linear Regression Channels – Helps determine the current trend. If both are directed in the same direction, it means the trend is currently strong.
- Moving Average Line (settings 20.0, smoothed) – Determines the short-term trend and the direction in which trading should currently be conducted.
- Murray Levels – Target levels for movements and corrections.
- Volatility Levels (red lines) – The probable price channel in which the pair will spend the next day, based on current volatility indicators.
- CCI Indicator – Its entry into the oversold area (below -250) or the overbought area (above +250) means that a trend reversal in the opposite direction is imminent.