Analyzing Thursday's trades:
EUR/USD on 1H chart
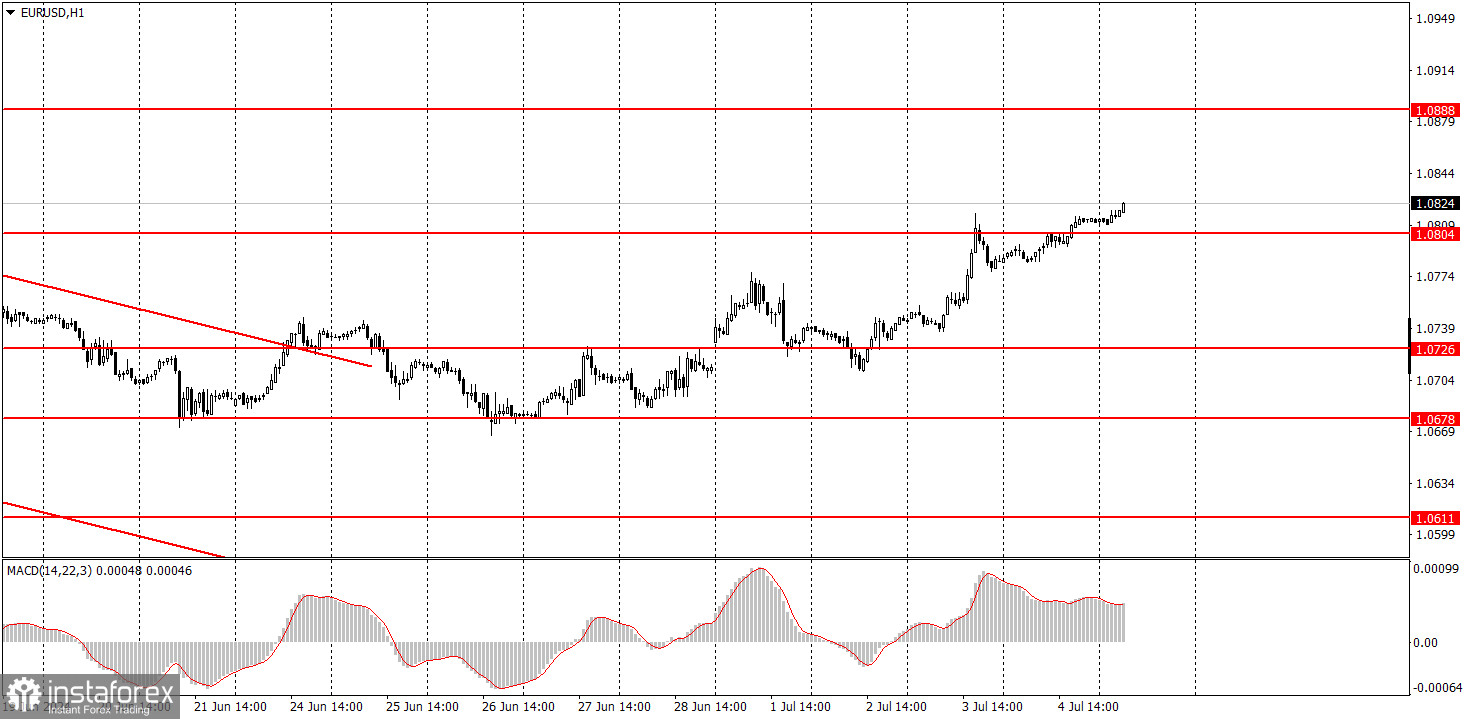
EUR/USD showed a small upward movement on Thursday. US markets were closed for the Independence Day holiday. Nevertheless, even under such conditions, the dollar continued to depreciate. There were no fundamental or macroeconomic events throughout the day, and yet the dollar continued to decline.
The pair continues to rise on Friday, even though trading sessions in both the Eurozone and the U.S. have not yet opened, and there have been no new reports at the moment. Therefore, we are dealing with an illogical rise once again, which cannot be explained from a fundamental or macroeconomic perspective. However, from a technical perspective, everything appears to be logical on the hourly TF. The price failed to break through the 1.0678 level thrice, which triggered a new upward movement. In general, the dollar's problem is that no one in the market wants to buy it under any circumstances.
EUR/USD on 5M chart
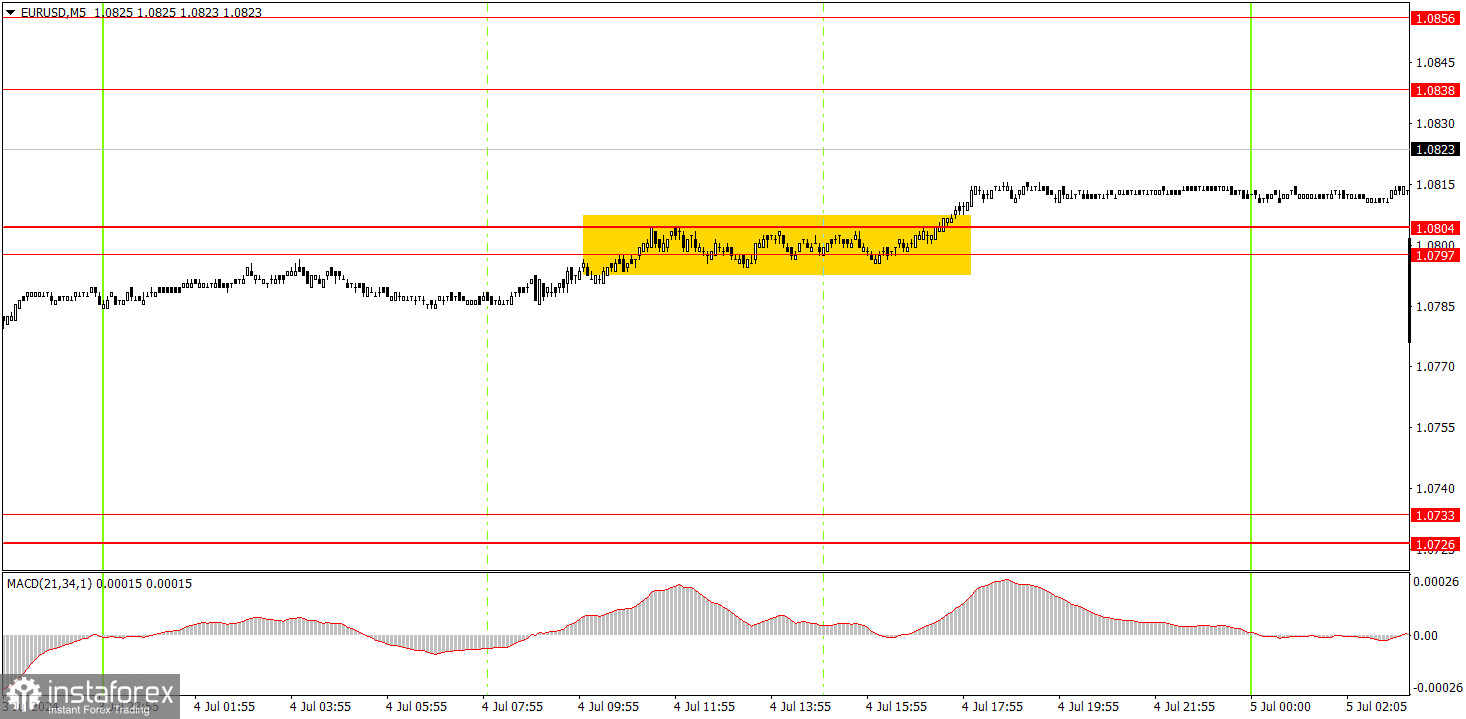
Only one trading signal was formed on the 5-minute timeframe. During the European and US sessions, the price spent a long time trying to break through the 1.0797-1.0804 area, and after six hours of struggle, it finally succeeded. Following this, it managed to move in the intended direction by about 10 pips. The long position could have been carried over to Friday, as it is extremely difficult to count on profit within a single day given the current volatility. However, the U.S. will release important reports later today, which could potentially turn the pair downwards.
Trading tips on Friday:
On the hourly chart, EUR/USD was unable to break through the 1.0678 level, and this week's economic reports have mostly supported the euro rather than the dollar. Therefore, the euro's rise was quite logical. Despite this movement, the overall (downward) trend has not changed, but the euro has been trading with very frequent and strong corrections over the past 7-8 months. Formally, the euro is falling, as seen on higher timeframes, but the process has been extremely slow.
On Friday, traders can expect the pair to continue its upward movement because right now the market doesn't need any particular reasons to buy the euro. The only thing that can save the dollar is strong U.S. data.
The key levels on the 5M chart are 1.0483, 1.0526, 1.0568, 1.0611, 1.0678, 1.0726-1.0733, 1.0797-1.0804, 1.0838-1.0856, 1.0888-1.0896, 1.0940, 1.0971-1.0981. Today, the Eurozone retail sales report will be published, while the U.S. docket will feature crucial reports on NonFarm Payrolls, unemployment, and wages. We can expect strong movements, sharp reversals, and increased volatility in the second half of the day.
Basic trading rules:
1) Signal strength is determined by the time taken for its formation (either a bounce or level breach). A shorter formation time indicates a stronger signal.
2) If two or more trades around a certain level are initiated based on false signals, subsequent signals from that level should be disregarded.
3) In a flat market, any currency pair can produce multiple false signals or none at all. In any case, the flat trend is not the best condition for trading.
4) Trading activities are confined between the onset of the European session and mid-way through the U.S. session, after which all open trades should be manually closed.
5) On the 30-minute timeframe, trades based on MACD signals are only advisable amidst substantial volatility and an established trend, confirmed either by a trendline or trend channel.
6) If two levels lie closely together (ranging from 5 to 15 pips apart), they should be considered as a support or resistance zone.
How to read charts:
Support and Resistance price levels can serve as targets when buying or selling. You can place Take Profit levels near them.
Red lines represent channels or trend lines, depicting the current market trend and indicating the preferable trading direction.
The MACD(14,22,3) indicator, encompassing both the histogram and signal line, acts as an auxiliary tool and can also be used as a signal source.
Significant speeches and reports (always noted in the news calendar) can profoundly influence the price dynamics. Hence, trading during their release calls for heightened caution. It may be reasonable to exit the market to prevent abrupt price reversals against the prevailing trend.
Beginners should always remember that not every trade will yield profit. Establishing a clear strategy coupled with sound money management is the cornerstone of sustained trading success.